See the workbench in motion.
Every screen below is the real Statios — running entirely in the browser, computing on your device. From raw data to a cited, reproducible, publication-ready result, without a single upload.
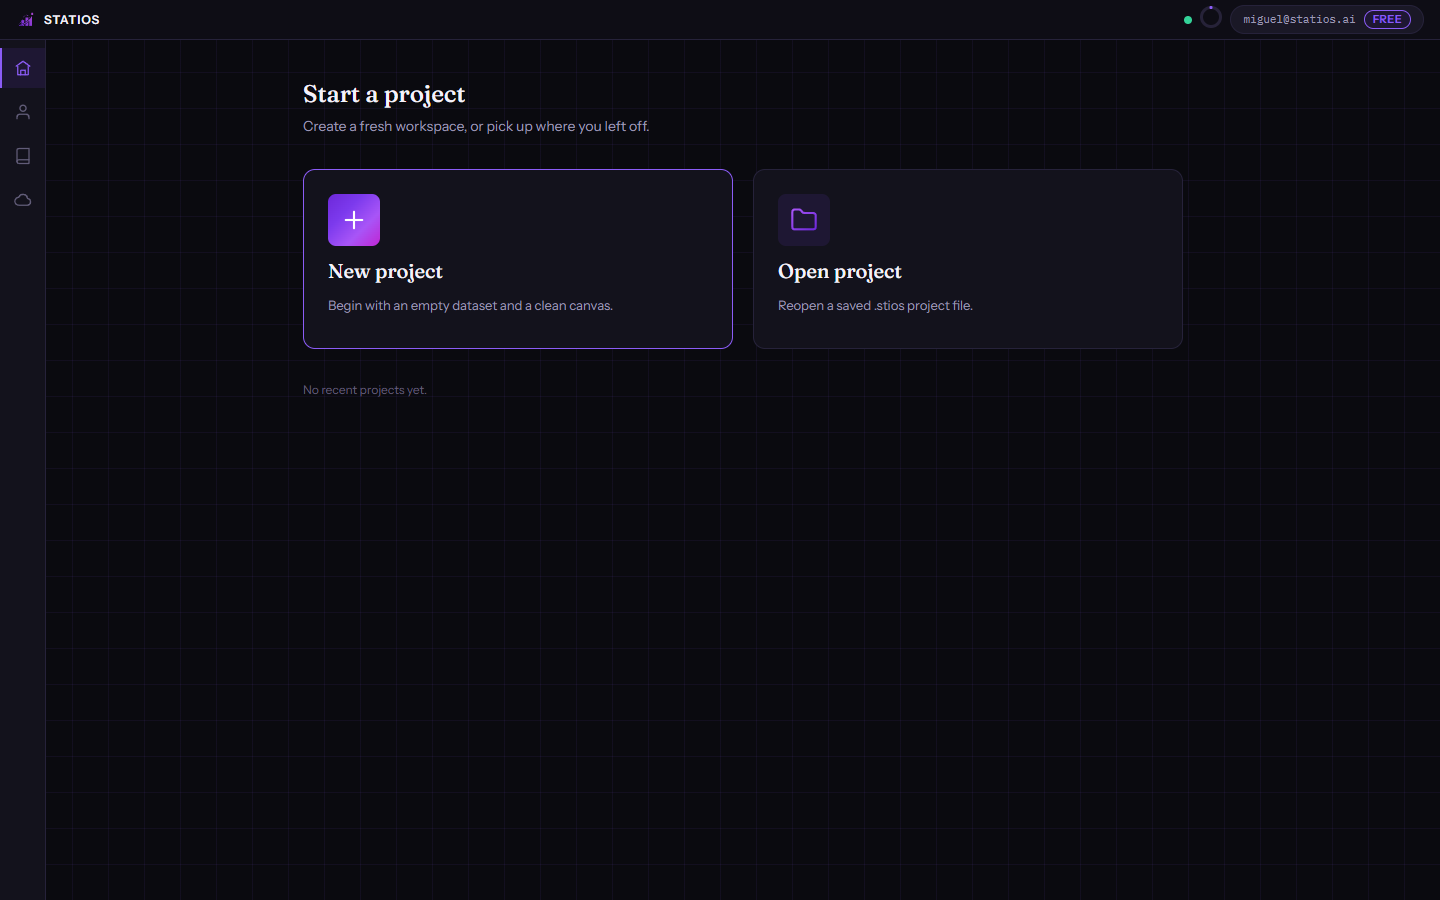
Your projects, right where you left them.
Sign in and land in the Lobby — a clean start screen showing your recent projects, account status and usage. Open an existing project or start a new one with a single click, then the full workbench loads instantly.
- New / Open — one click to create or resume a project
- Recent projects listed with last-modified timestamps
- Account chip and usage summary always in reach
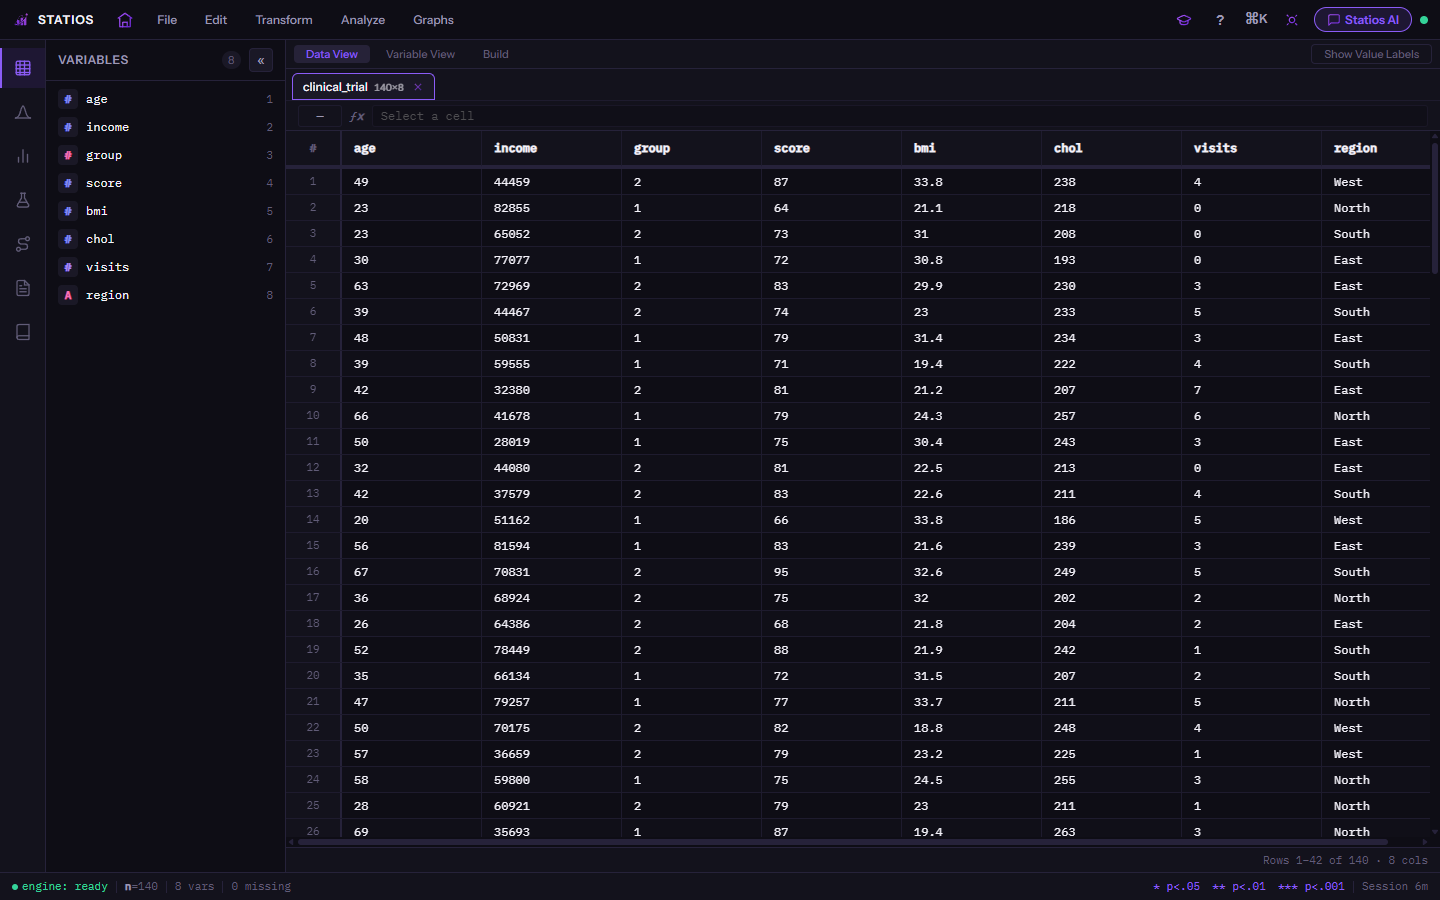
A spreadsheet that thinks in statistics.
Open a CSV, Excel, SPSS .sav or Stata .dta and it's instantly live — a fast, windowed grid with a formula bar, type-aware columns and inline editing.
- Hundreds of thousands of rows scroll fluidly; the engine reaches into the millions
- Excel-style formulas, transforms, recodes and computed columns
- Full undo/redo — every edit is tracked
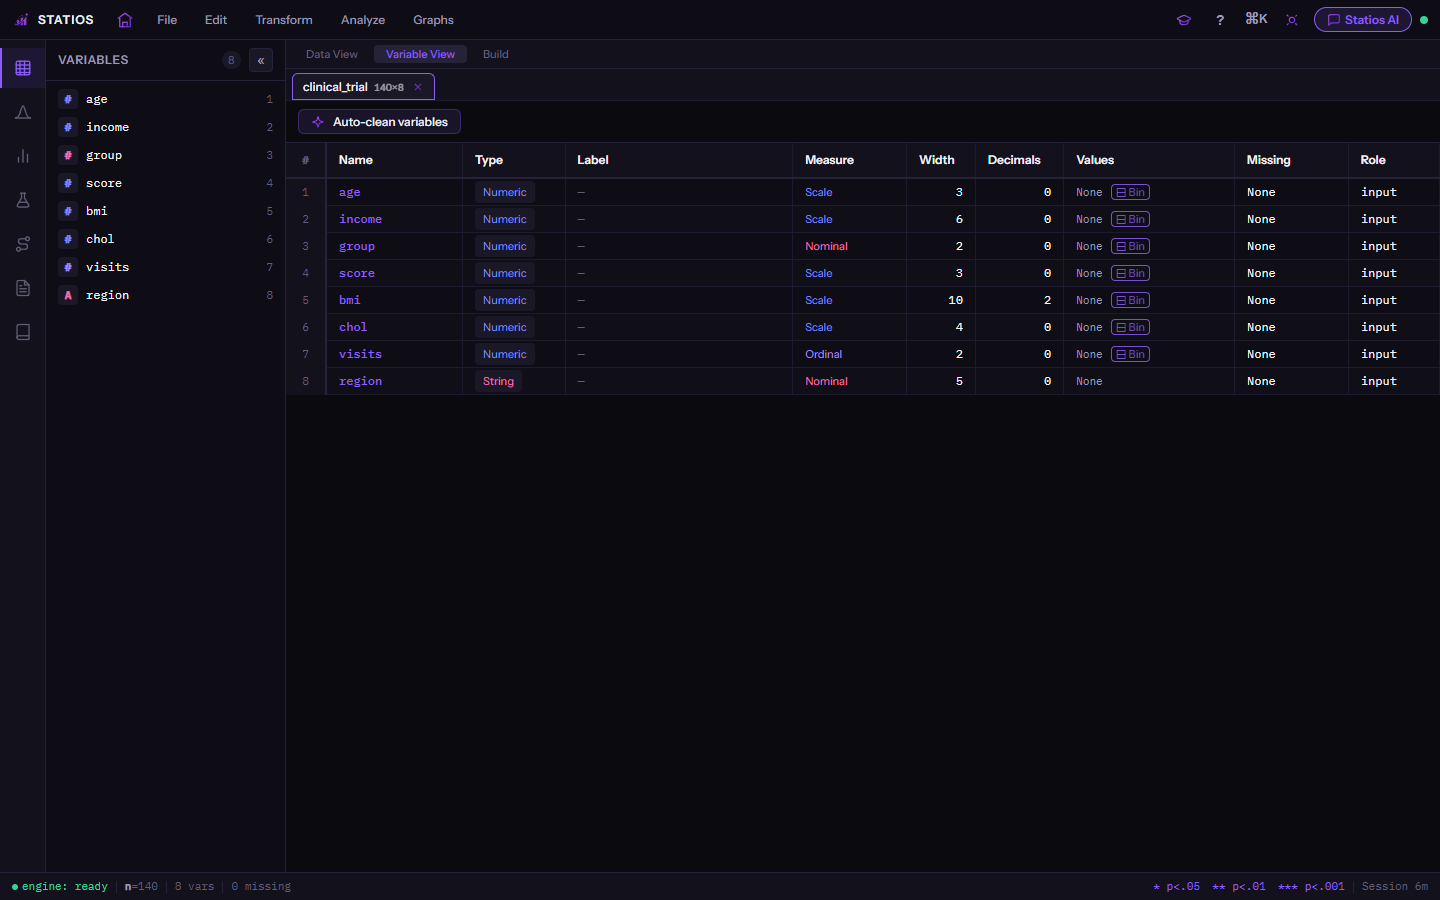
SPSS-style metadata, done right.
A proper Variable View: set type, measurement level, value labels and roles — the metadata real analysis depends on. Continuous fields get one-click Visual Binning.
- Value labels & auto-encode categoricals for modelling
- Visual Binning — cut a scale into groups with live previews
- Measurement levels flow through every downstream test
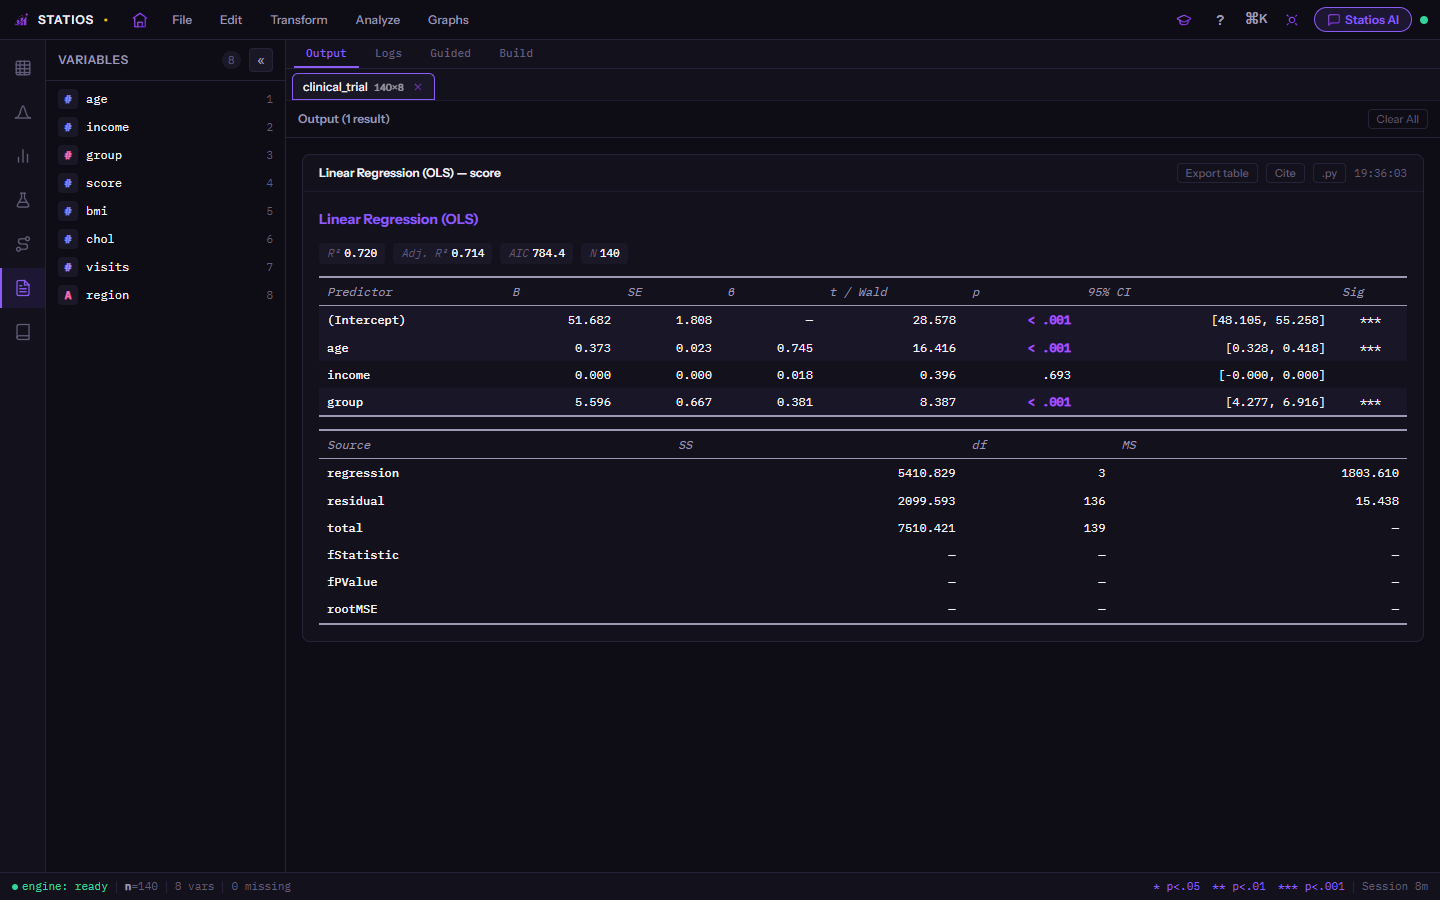
Every result arrives cited.
Run an analysis and you get a clean, APA-style card — coefficients, robust SEs, effect sizes, confidence intervals and significance — with a Cite button on every output.
- One click copies the methodological references behind the result
- The numeric engine is validated against R on a committed golden-fixture suite
- Diagnostics and assumption checks travel with the estimate
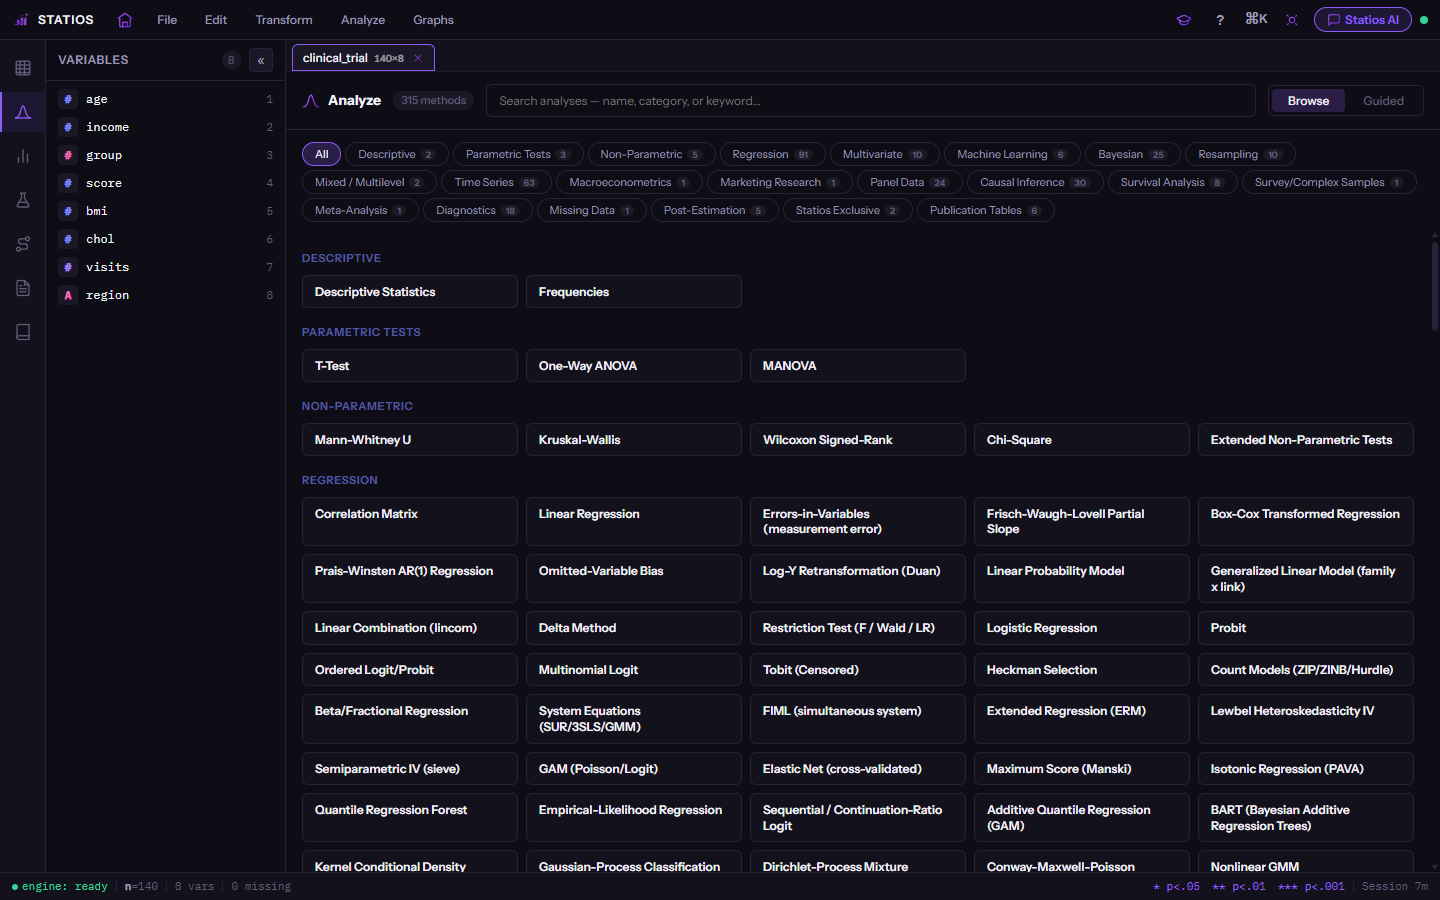
The scope of five tools, in one menu.
Regression families, multivariate & latent-variable models, time series & macroeconometrics, panel data, causal inference, survival, Bayesian, machine learning — 600 procedures, all on-device.
- SPSS + Stata + EViews coverage without four licenses
- Every method computed by an open, auditable Python engine
- Native .sav / .dta / Excel / CSV — read and written
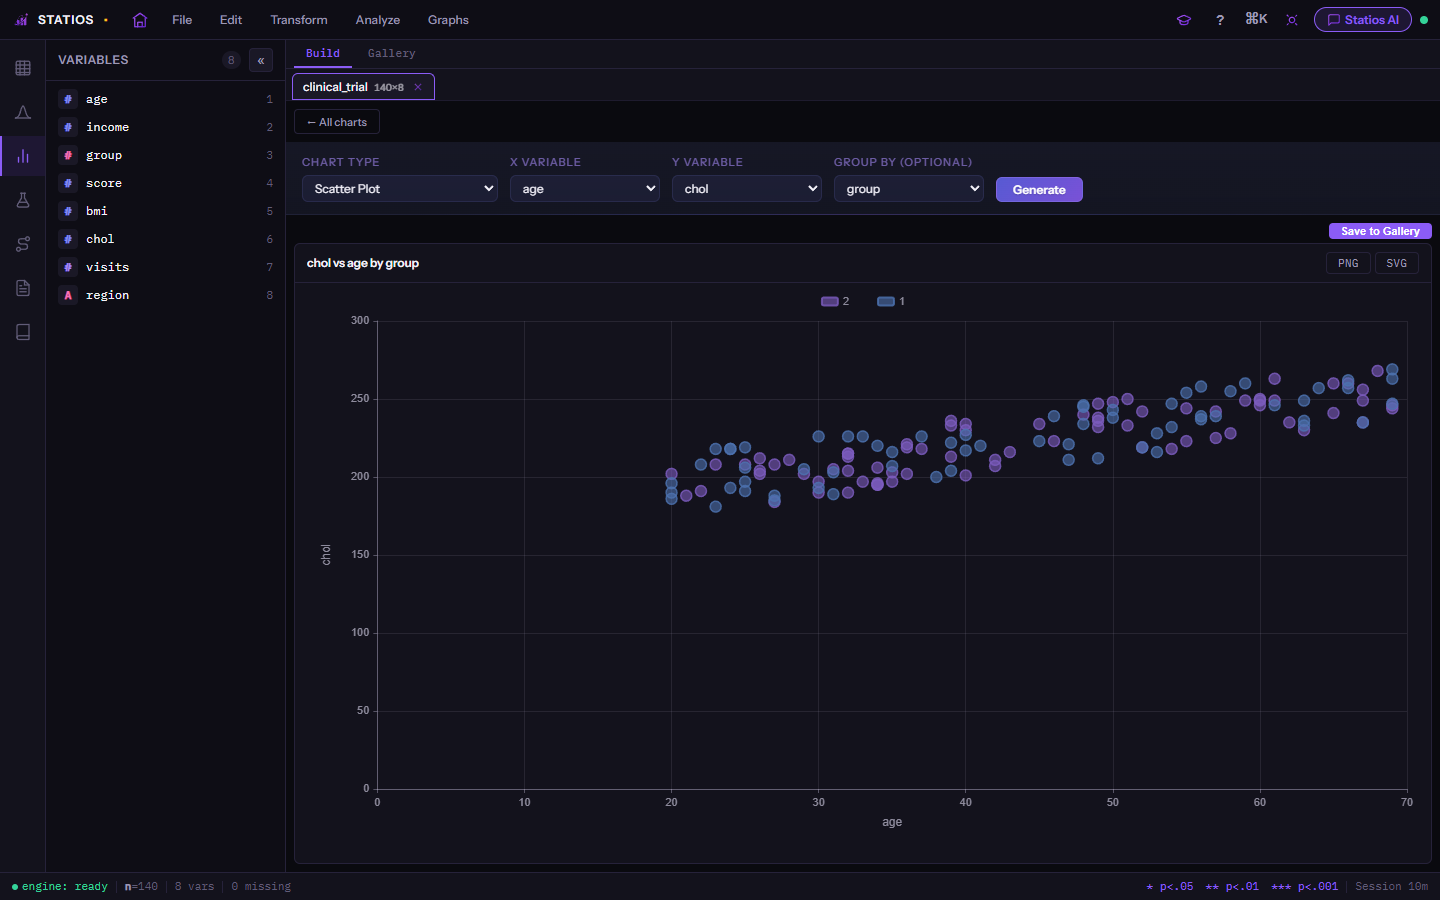
37 chart types, publication-clean.
Build grouped scatter, distributions, box and violin plots, correlation heatmaps, survival curves, forest plots and more — themed to match, interactive on hover.
- Group, facet and color by any variable
- High-res export to PNG (300dpi) or vector SVG
- Dark / light theme-aware palettes
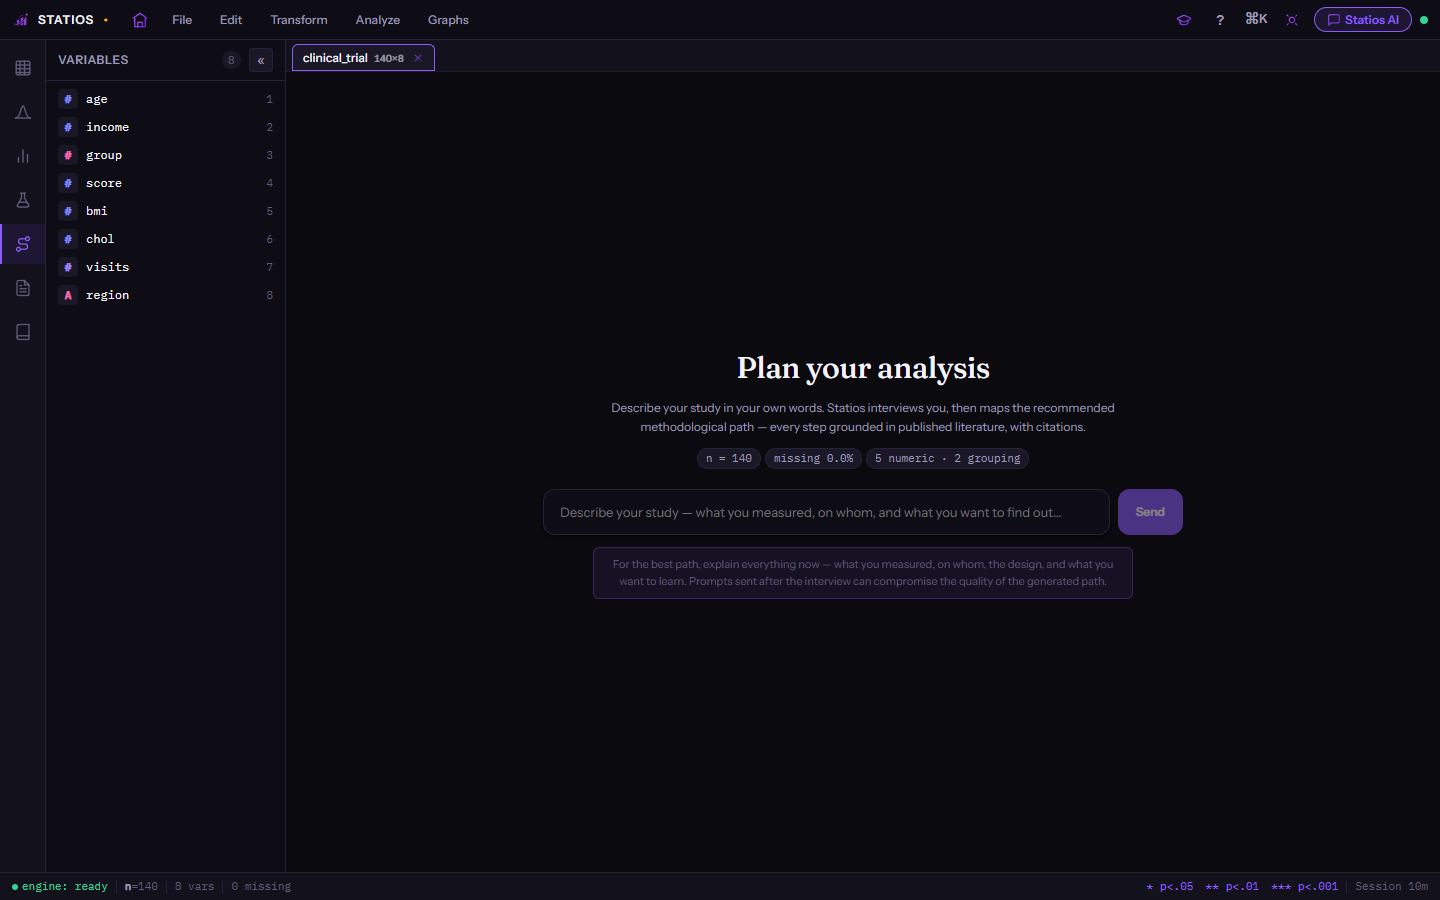
Method choice grounded in literature.
"Which test should I run?" — answered by a versioned knowledge base of decision rules drawn from published methodology. The AI only interviews you; the rules choose the methods, and every step ships with citations.
- Describe your study in plain words; get a defensible plan
- Deterministic planner — same study, same plan, reviewable
- Export the cited justification for your methods section
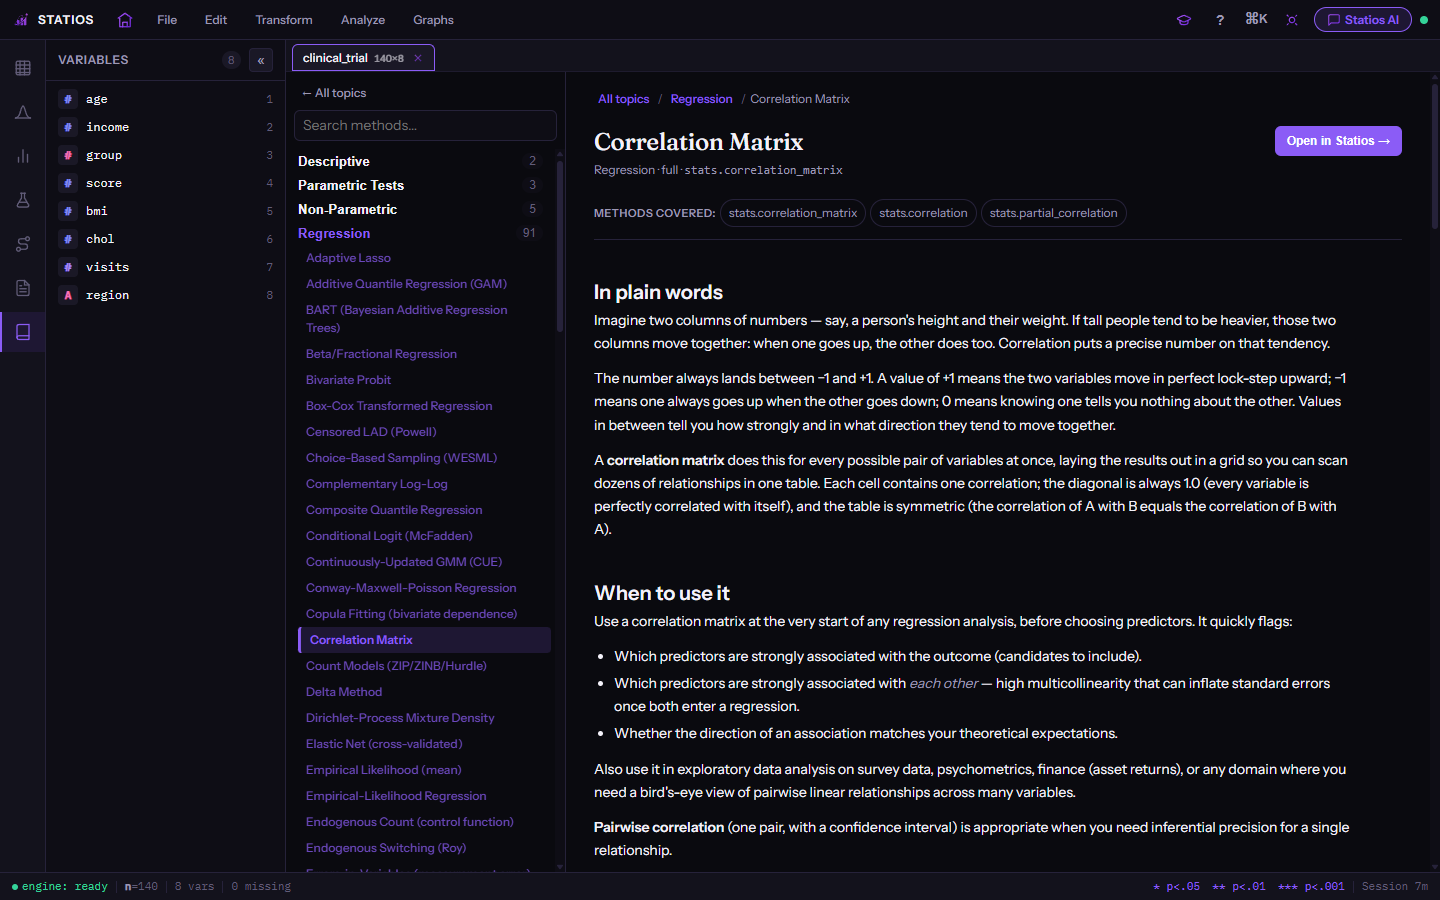
A statistics reference, built in.
Every method comes with a plainly-written, PhD-depth explainer — what it does, when to use it, the assumptions and the math — fully cited, and one click from running it. 315 articles covering all 600+ procedures.
- Searchable and cross-linked, with the source each method comes from
- Open in Statios — jump from an article straight to the dialog that runs it
- No tab-switching to Google — the reference lives beside your work
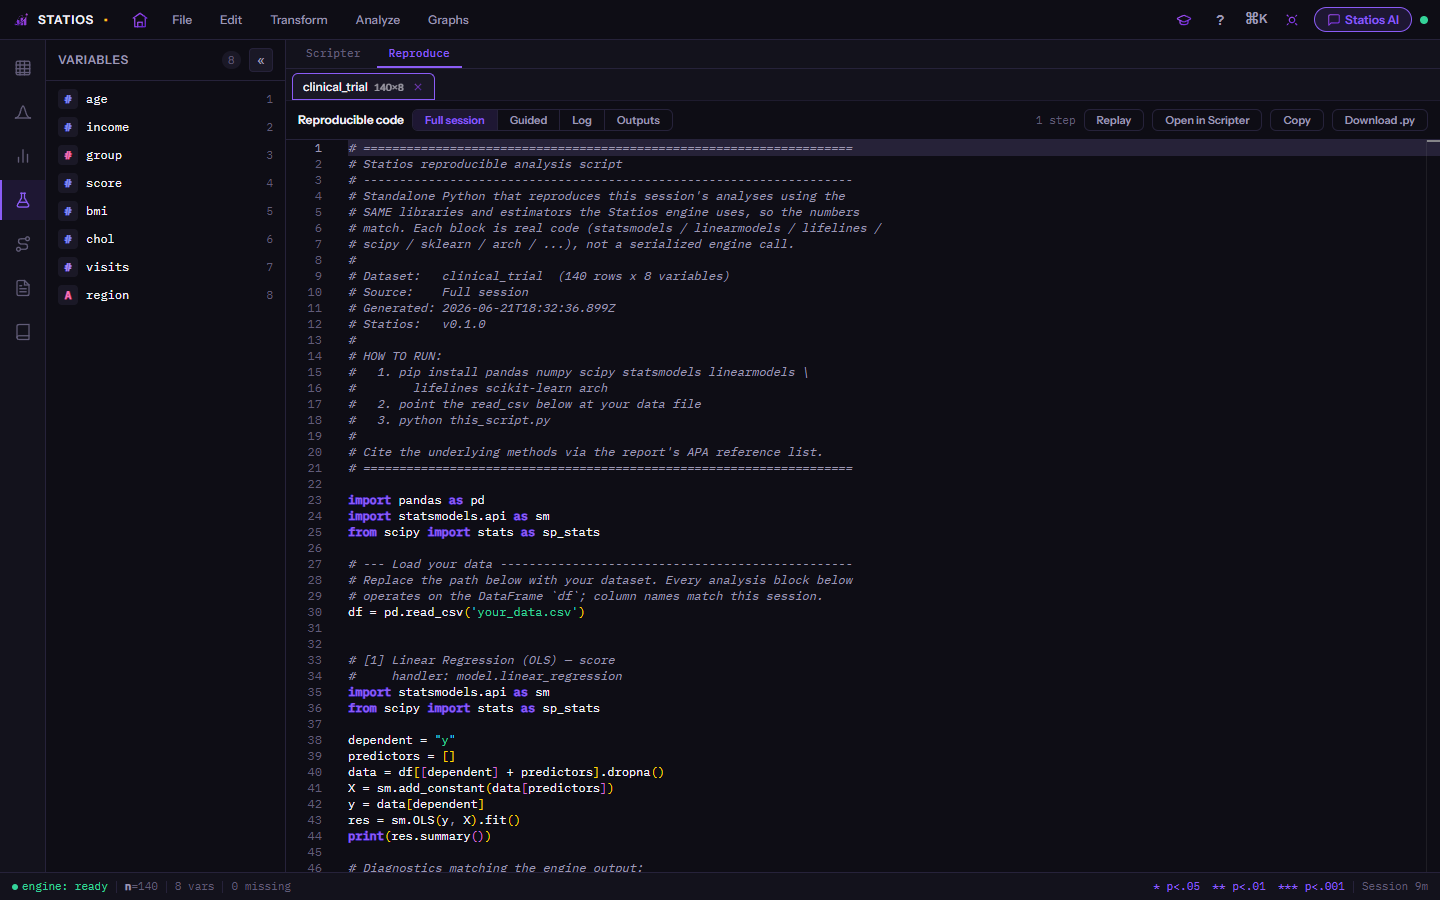
Your whole session, as a script.
Everything you click is recorded as a deterministic Python script — a faithful replay of the exact engine calls, in order. Not AI-generated: each call is rendered from a per-method template into real Python (statsmodels / scipy / lifelines / …), runnable outside Statios with only open-source deps.
- Copy or download .py — ready for a paper's code appendix
- Re-run it to regenerate every figure on the same data
- Pairs with the report's APA reference list
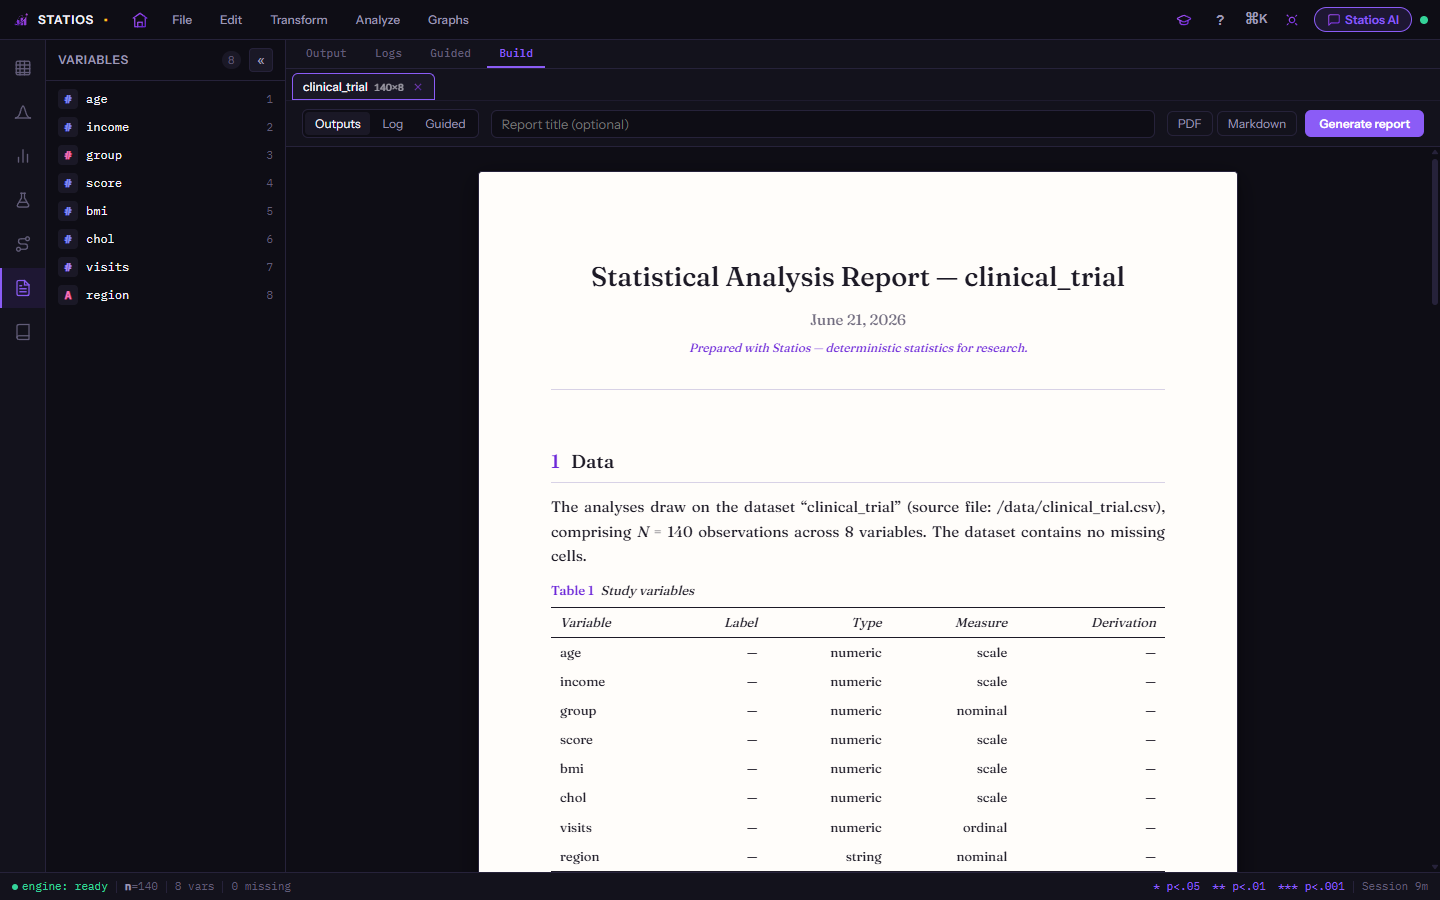
From clicks to a finished document.
Assemble a typeset Statistical Analysis Report — a deterministic layout of data, methods, APA results, tables and figures, ending in a reproducible-code appendix with a complete reference list.
- Export to PDF or Markdown in a click
- Automatic References section — nothing to assemble by hand
- "Prepared with Statios — deterministic statistics for research"

That's the lab. Open it.
No install, no upload — a free account lets you start in seconds, and your data stays on your machine.